Home > Data Visualization > ChartWidgets

ChartWidgets Verified
65 live US economic charts, explained and free to embed
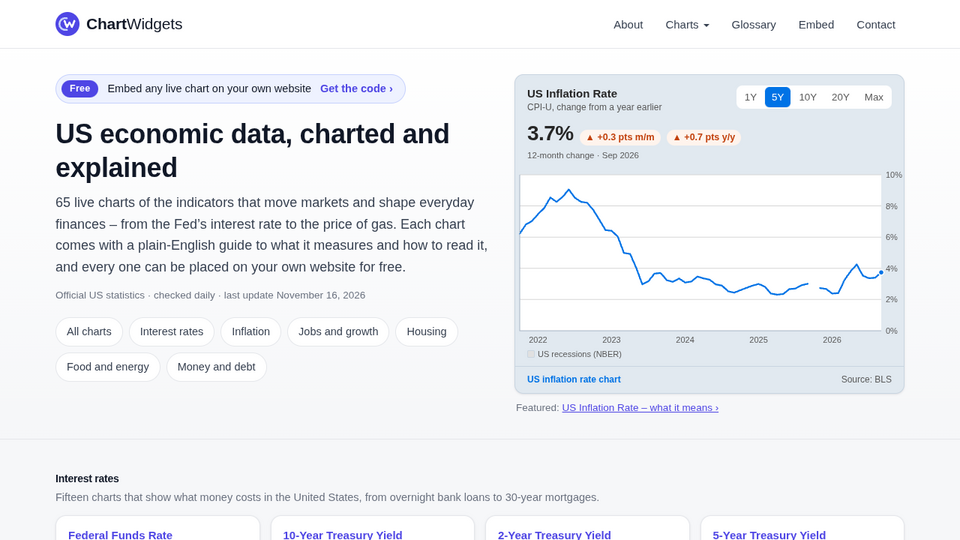
Screenshot of chartwidgets.comOpen website ↗
About this tool
ChartWidgets offers 65 live charts of key US economic indicators, from interest rates and inflation to jobs, housing, and energy prices. Each chart includes a plain-English guide explaining what it measures and how to read it. All charts can be embedded on your own website for free.
Related tools

InfoCaptor
Data Visualization and Dashboards

STRProfitMap
STRProfitMap is data analytics Saas for airbnb investors.

Pin Sheet Pro
A professional golf pin sheet management system

🌱kvitly
Your business, simplified with AI-powered sidekick

Grid Guy - F1 Stats
Track the F1 Season to see how far the leader has pulled ahead

drawcharts
create hand-drawn style charts and visualizations in seconds
Submit your Tool
Publish your website on Twelve.Tools and get a DR 83 dofollow backlink to boost your SEO
Submit NowFrogDR
Monitor your Domain Rating